| Question | Type | Example |
|---|---|---|
| What are summarized characteristics of a data set without interpretation? (i.e., report a fact) | Descriptive | Have monthly profit margins changed in the last 2 years? |
| Are there patterns, trends, or relationships within a single data set? (Often use to propose hypotheses for future study) | Exploratory | Are monthly profit margins related to underlying economic factors? |
| Are there patterns, trends, or relationships in a data set AND how applicable are findings to a wider population? | Inferential | Are monthly profit margins for all companies related to economic factors? |
| Can measurements (features) predict for individuals (people or things) predict outcomes, but not what causes the outcome? | Predictive | Can economic factors predict a company's future profit margins? |
Introduction
BUS 320 Business Data Analysis and Interpretation
Elizabeth Stanny
What is business analytics?
is the iterative process of learning from data, transforming data into insights for making better decisions
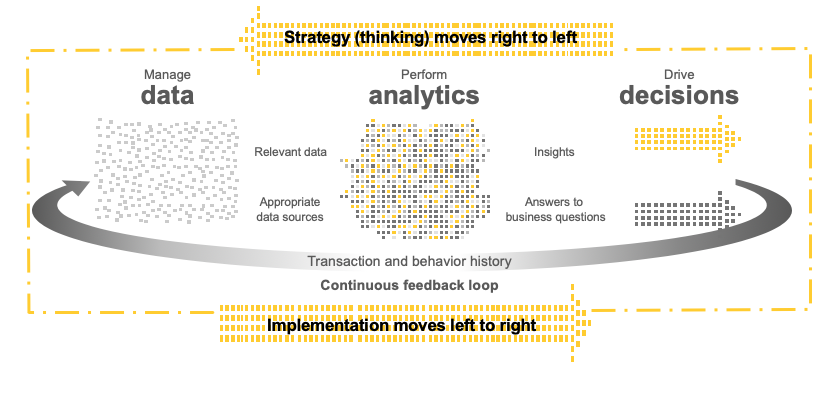
Source: Introduction to the analytics mindset (slide 25), SCORE No. 01875-161US, www.ey.com/us/arc.
Business analytics includes
- Audit Analytics
- Financial Analytics
- Human Resource Analytics
- Marketing Analytics
- Sport Analytics
- Tax Analytics
- Web Analytics
What is analytics?
- extracting value from data
- limited in the past by software (e.g.,
Excel) and hardware - today can use powerful tools (e.g.
R) to more efficiently and effectively analyze a broader range of data and types of data than with (Excel) - allow for enhanced insights from data to address business issues and transform the way decisions are made
Adapted from: Introduction to the analytics mindset (slide 11), SCORE No. 01875-161US, www.ey.com/us/arc
The human element
Despite the increased sophistication of the data and the analytics, the most important aspect continues to be the human element, which includes:
critical thinking and judgment!

Adapted from: Introduction to the analytics mindset (slide 12), SCORE No. 01875-161US, www.ey.com/us/arc. Photo by Bacila Vlad on Unsplash
Learning objectives
- Determine question want to answer with data analysis
- Extract, transform and load relevant data (ETL process)
- Apply appropriate data analytic methods
- Interpret and present the results
1. Determine question want to answer with data
- Who are the relevant stakeholders?
- What are their objectives?
2. ETL process (data wrangling)
- Extract (determine data will answer questions)
- Load (import/read)
- Transform (tidy)
3. Apply appropriate analytic method
Adapted from: https://datasciencebook.ca/intro.html#asking-a-question
Descriptive Analysis
Descriptive statistics includes statistics such as mean, standard deviation, and count.
These statistics help describe the overall characteristics of a data set.
Provides insights into what has already happened.
-
Doesn’t involve making any predictions or inferences about the data.
- Example: A retailer uses descriptive analysis to understand the average sales per day, the most popular items sold, and the typical customer demographics.
Exploratory Analysis
Exploratory analysis is used to understand the data, get a feel for it, formulate hypotheses, and create visualizations.
The step that comes before formal, hypothesis testing and modeling.
-
Uses visual methods to understand data patterns, relationships, or anomalies, and extracts important variables.
- Example A retailer uses exploratory analysis to understand the correlation between promotions and sales revenue.
Inferential Analysis
Inferential analysis is used to make predictions or inferences about a population based on data from a sample of that population.
-
Involves statistical tests to determine whether we can generalize findings from a sample to a larger population.
- Example: A medical researcher might collect data from a small group of people (a sample) to determine if a new drug works. Using inferential statistics, the researcher can then infer if the same results would occur in the larger population.
Predictive Analysis
-
Predictive analysis is used to make predictions about future events based on current and historical data.
-
Examples:
- A weather forecaster uses predictive analysis to predict future weather based on past weather patterns.
- A financial analyst uses predictive analysis to forecast future stock prices based on historical data.
-
Examples:
Your turn
Determine the type of analysis for each of these:
- Company wants to forecast future trends based on historical data, which type of analysis should they use?
- What type of analysis would a business use to investigate potential relationships between variables in a new dataset?
What type of analysis is used to draw conclusions from a sample of data and make inferences about the population from which it was drawn?
If a company wants to present a summary of their past sales data, which type of analysis should they use?
4. Interpret and present results
Interpret
What do you see?
Do you see what you expected to see?
Do your results make sense to you?
Is any further analysis required to meet your objective?
Present
How will your audience best receive the information?
How much time you will have to present?
Whether the presentation will be in person or virtual?
What the best format of the presentation will be?
Whether you have any additional recommendations for further analysis?
Adapted from: Introduction to the analytics mindset (slide 41), SCORE No. 01875-161US, www.ey.com/us/arc
Learning objectives for this class (again)
- Determine question want to answer with data
- Extract, transform and load relevant data (ETL process)
- Apply appropriate data analytic techniques
- Interpret and share the results
R will be our main tool
Create reproducible results
Data analysts who don’t organize their transformation pipelines often end up not being able to repeat their analyses, so the advice I would give to myself is the same advice often given to traditional scientists: make your experiments repeatable!
Source: Mike Driscoll, Founder & CEO at Metamarkets https://www.kdnuggets.com/2017/05/42-essential-quotes-data-science-thought-leaders.html/2
Course Overview
Hompage
- Links to all course materials