Data
Material based on Chapter 1 Introduction to Modern Statistics
Learning objectives
-
Types of data collection
- experimental vs observational
- understanding confounding variables
-
Types of variables
- numeric vs categorical
-
Sampling and representation
- representative samples
- random assignment
Tidy data
Summary statistics and associations
Setting Up Our Tools
Tip
The tidyverse is a collection of R packages designed for data science!
Can Stents Prevent Strokes?
The Big Question: Do stents reduce the risk of stroke?
The Experiment:
- 451 at-risk patients
- Randomly assigned to two groups:
- Treatment: Stent + medical care (224)
- Control: Medical care only (227)
Why Random Assignment?
- Ensures groups are comparable
- Eliminates selection bias
- Allows causal inference
Outcome of stent experiment
| group | no event | stroke | Total |
|---|---|---|---|
| control | 199 | 28 | 227 |
| treatment | 179 | 45 | 224 |
Data stent365 from openintro package.
Does the use of stents reduce the risk of stroke?
Compare 2 summary statistics:
Proportion who had a stroke in the treatment (stent) group: \(45/(179 +45) = 0.20 = 20\%.\)
Proportion who had a stroke in the control group: \(28/(199 +28) = 0.12 = 12\%.\)
summary statistic is a single number summarizing data from a sample
| group | no event | stroke |
|---|---|---|
| control | 88% | 12% |
| treatment | 80% | 20% |
What is Data?
Data are observations collected from a study or experiment.
Note
Each row is an observation (also called a case)
Each column is a variable
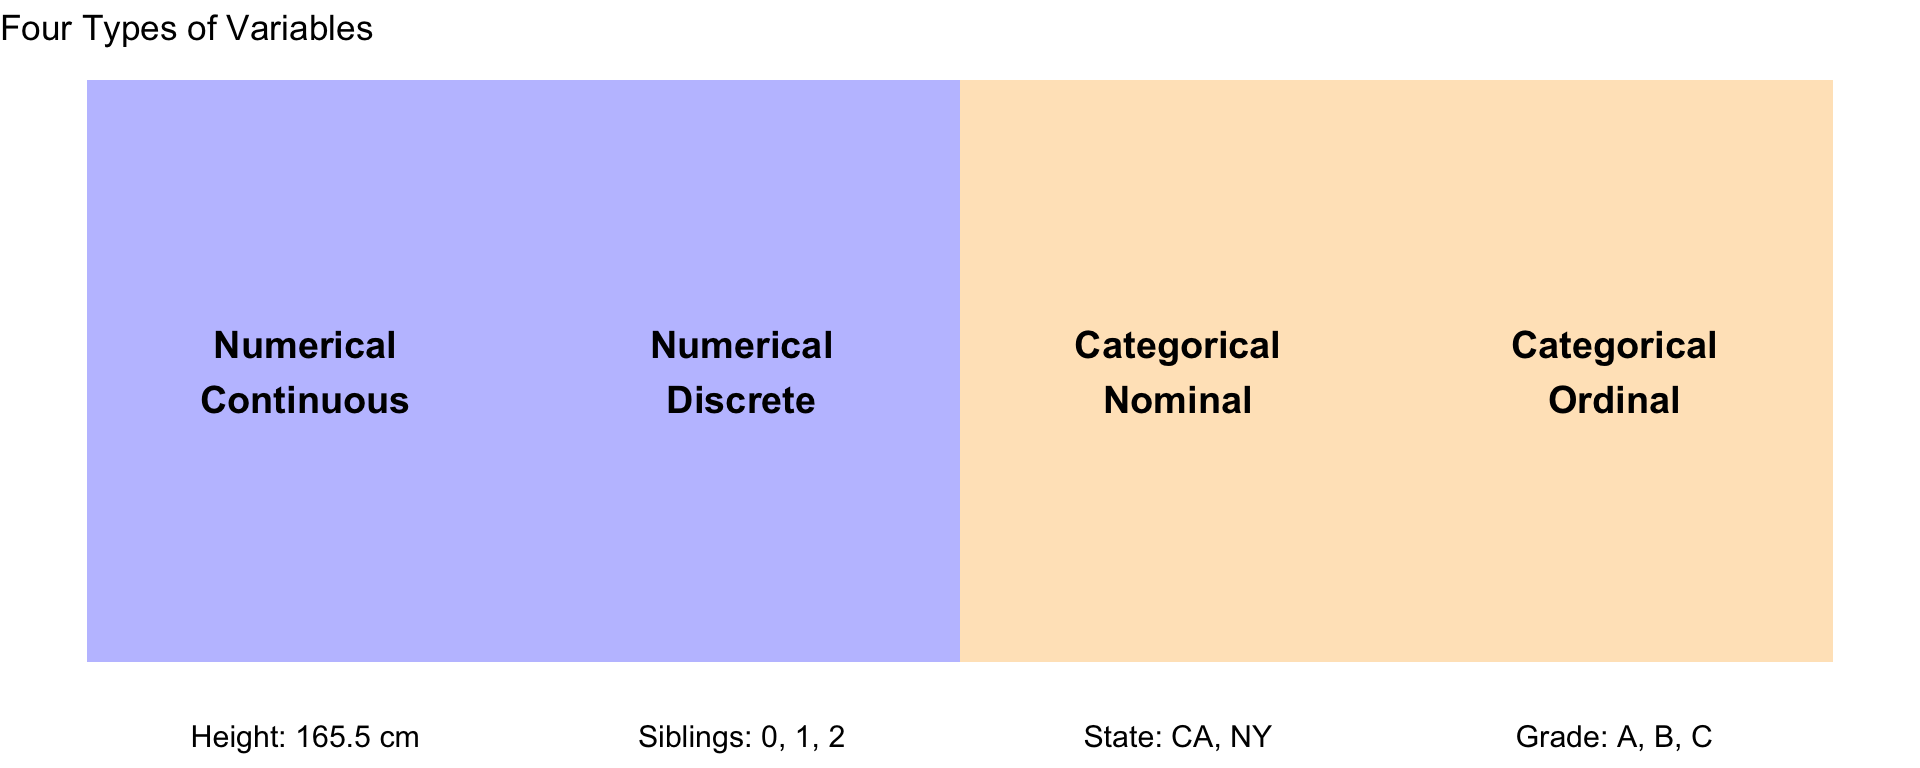
Types of Variables
Tidy Data
A data frame where
- each row is a unique case (observational unit)
- each column is a variable
- each cell is a single value
Tip
Why Tidy?
- Consistent structure makes analysis easier
- Works seamlessly with tidyverse tools
- Reduces errors in data manipulation
Explanatory and response variables
explanatory variable → might affect → response variable
Examples:
- Study hours (explanatory) → Test score (response)
- Treatment type (explanatory) → Recovery time (response)
- Marketing spend (explanatory) → Sales (response)
Relationship between variables
- Associated variables: two variables that show some connection with one another
- Independent variables: not associated
Warning
Association ≠ Causation!
Representative Samples
What makes a sample representative?
A representative sample accurately reflects the characteristics of the population it’s drawn from.
Good Representative Sample:
- Random selection
- Adequate size
- Mirrors population demographics
- No systematic exclusions
Poor Representative Sample:
- Convenience sampling
- Self-selection bias
- Too small
- Missing key groups
Example: Surveying only online users about internet usage would not represent the entire population
Scatterplots and Associations
Reading relationships in scatterplots
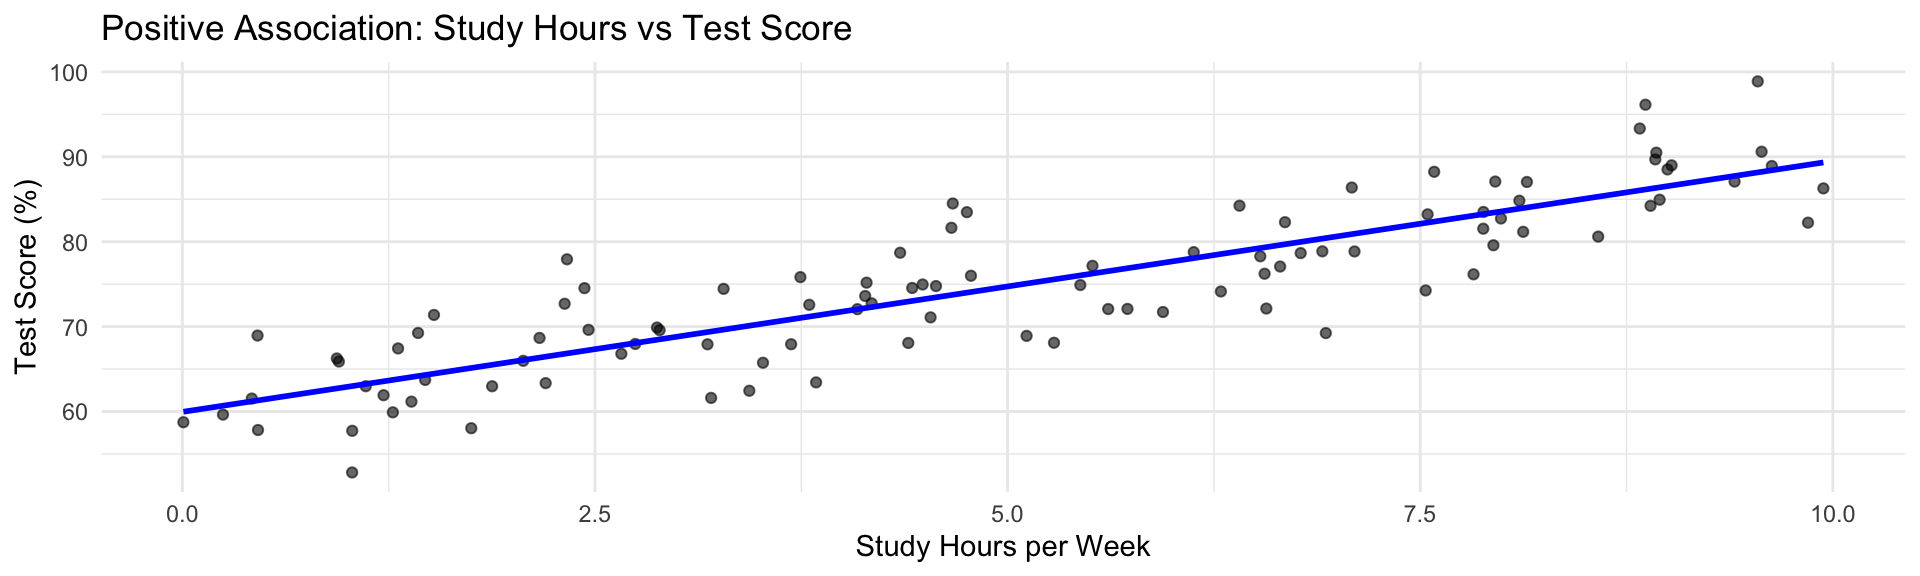
Positive association: As one variable increases, the other tends to increase
- Points trend upward from left to right
- Example: More study hours → Higher test scores
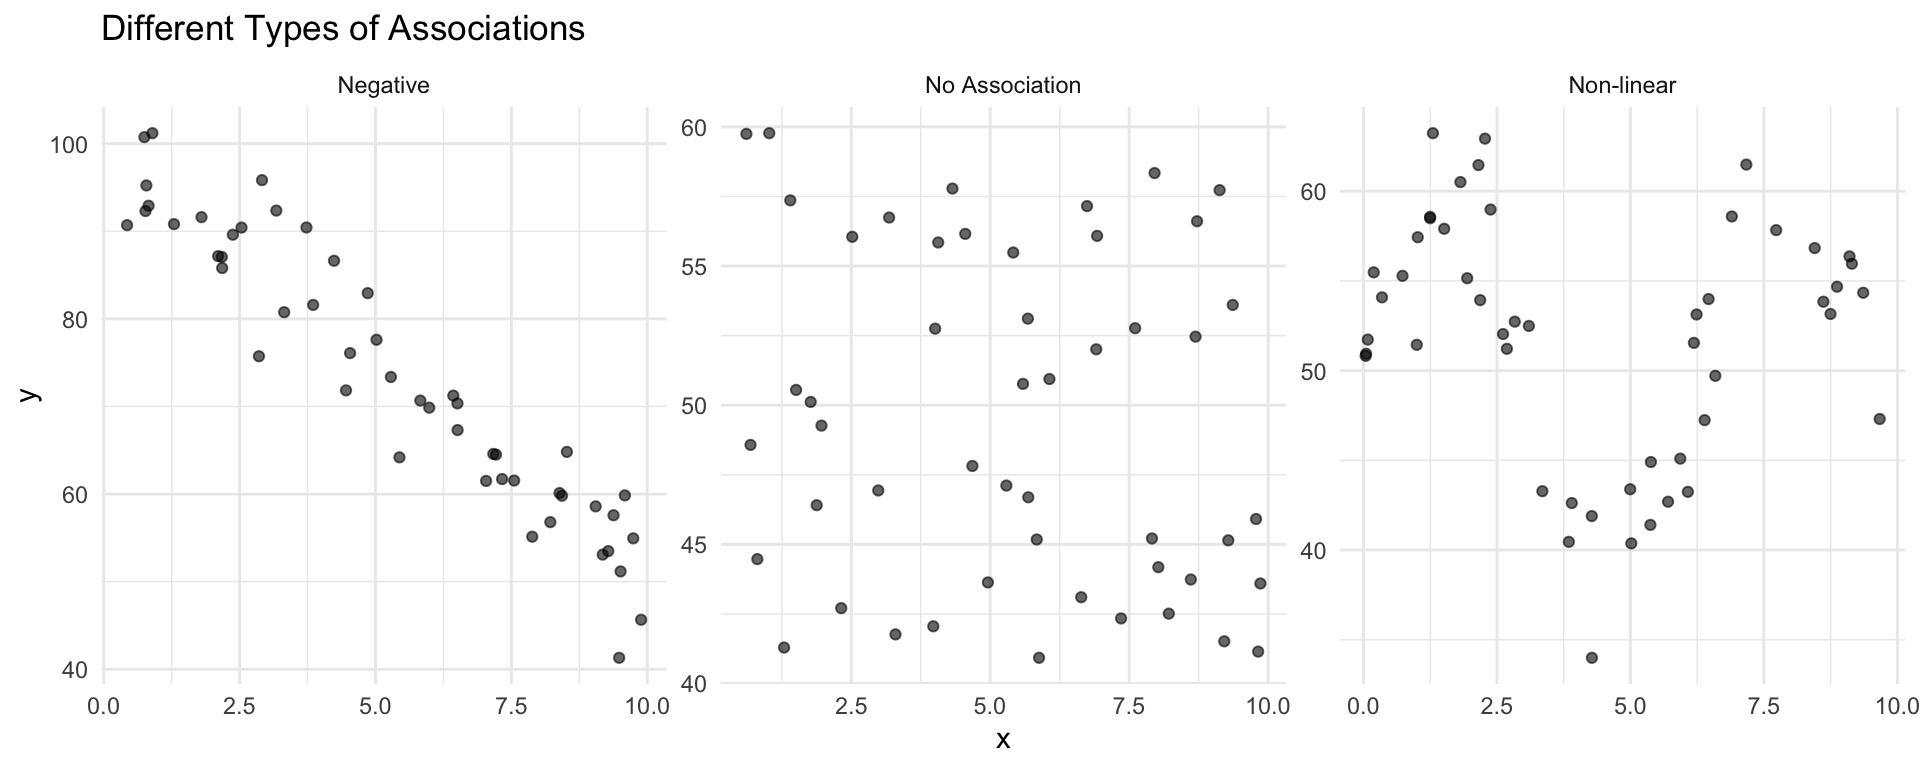
Types of Associations in Scatterplots
Confounding Variables
The hidden influencers
A confounding variable affects both the explanatory and response variables, creating a spurious association.
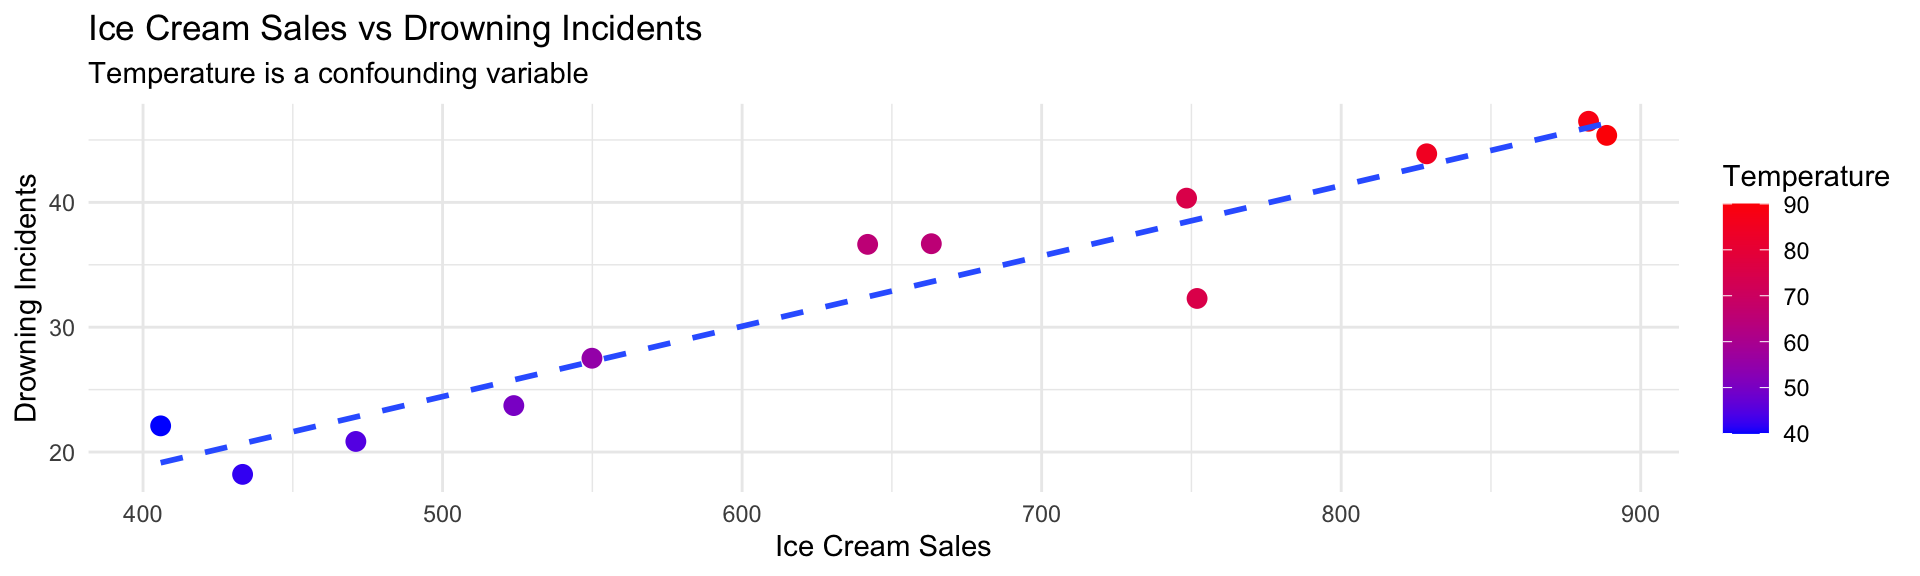
Warning
Ice cream doesn’t cause drowning! Temperature affects both.
Identifying Confounding Variables
Ask yourself:
- Could there be a third variable affecting both?
- Does the relationship make logical sense?
- What happens when we control for the potential confounder?
Classic Examples:
- Shoe size & reading ability in children (confounder: age)
- Cities with more churches have more crime (confounder: population size)
- Coffee consumption & heart disease (confounder: smoking)
Types of studies: observational vs experiment
Observational Studies
- Observe associations
- Collect via surveys/records
- Follow a cohort
- Cannot prove causation
- May have confounding variables
Experimental Studies
- Can infer causation
- Use random assignment
- Control confounding variables
- Manipulate explanatory variable
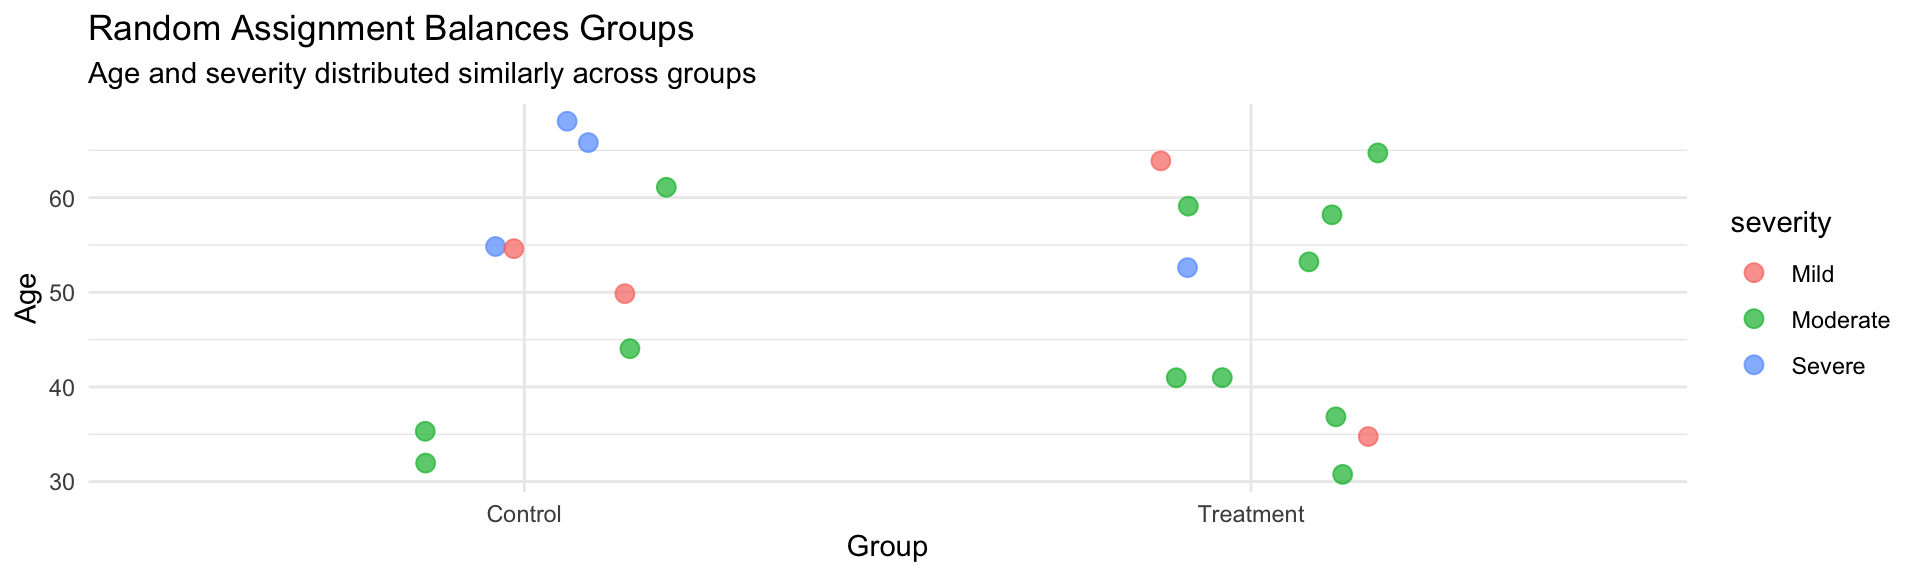
The Purpose of Random Assignment
Why randomize in experiments?
Random assignment serves critical purposes:
- Balances known and unknown variables across groups
- Eliminates selection bias
- Controls for confounding variables
- Enables causal inference
Random Assignment vs Random Sampling
Random Sampling
- From population to sample
- Goal: Generalizability
- Makes sample representative
- External validity
Random Assignment
- Within experiment
- Goal: Causal inference
- Balances groups
- Internal validity
Important
You can have one without the other!
- Lab experiment: Random assignment, not random sampling
- Survey: Random sampling, not random assignment
Your turn
12 Smoking habits of UK residents. A survey was conducted to study the smoking habits of 1,691 UK residents.
- Observational or experimental data collection?
- What does each row of the data frame represent?
- How many participants were included in the survey?
- Indicate whether each variable in the study is numerical or categorical. If numerical, identify as continuous or discrete. If categorical, indicate if the variable is ordinal.
| gender | age | marital_status | highest_qualification | nationality | ethnicity | gross_income | region | smoke | amt_weekends | amt_weekdays | type |
|---|---|---|---|---|---|---|---|---|---|---|---|
| Male | 38 | Divorced | No Qualification | British | White | 2,600 to 5,200 | The North | No | NA | NA | |
| Female | 42 | Single | No Qualification | British | White | Under 2,600 | The North | Yes | 12 | 12 | Packets |
| Male | 40 | Married | Degree | English | White | 28,600 to 36,400 | The North | No | NA | NA | |
| Female | 40 | Married | Degree | English | White | 10,400 to 15,600 | The North | No | NA | NA | |
| Female | 39 | Married | GCSE/O Level | British | White | 2,600 to 5,200 | The North | No | NA | NA | |
| Female | 37 | Married | GCSE/O Level | British | White | 15,600 to 20,800 | The North | No | NA | NA |
Key Concepts to Remember
- Data Structure: Rows are observations, columns are variables
- Variable Types: Numerical (continuous/discrete) vs. Categorical (nominal/ordinal)
- Relationships: Variables can be associated or independent
- Confounding: Third variables can create spurious associations
- Representative Samples: Must reflect population characteristics
- Scatterplot Associations: Positive, negative, none, or non-linear
- Random Assignment: Controls confounding and enables causal inference
- Causation: Only experiments with random assignment can prove causation
- R/Tidyverse: Our toolkit for exploring and visualizing data
Quiz Preview
- May be multiple answers to 2 questions worth 5 points each
- Use sample presented in question (not entire sample)