Study design
Material based on Chapter 2 Introduction to Modern Statistics
Review
- Types of data collection
- Experimental vs observational
- Tidy data
- Variables
- Explanatory vs response variables
- Associated vs independent
- Type
- Numeric: discrete vs continuous
- Categorical: nominal vs ordinal
- Summary statistics
Learning objectives
You should be able to:
- identify target population for your question
- identify individual case from target population
- describe difference between a census and a sample
- describe difference between sample statistic and a population parameter
- describe anecdotal evidence
- detail why random sampling is important
- describe how bias can be introduced into a sample
Identify the target population for your research question
Who is the target population for the study?
What is an individual case from the target population
Was the sample the same as the target population (census)
Difference sample statistic and population parameter
Population parameter is what you want to know
Sample statistic is your estimate of of it based on your sample
Example - E1a
American households spent an average of about $52 in 2007 on Halloween merchandise such as costumes, decorations, and candy.
To see if this number had changed, researchers conducted a new survey in 2008 before industry numbers were reported.
The survey included 1,500 households and found that average Halloween spending was $58 per household.
Identify the population mean and the sample mean
Your turn: E2 Sleeping in college.
A recent article in a college newspaper stated that college students get an average of 5.5 hours of sleep each night.
-
A student who was skeptical about this value decided to conduct a survey by randomly sampling 25 students.
- On average, the sampled students slept 6.25 hours per night
Identify the population mean and the sample mean
Your turn: E8 Cats on YouTube
Want to estimate the percentage of videos on YouTube that are cat videos.
Use a random video picker to select 1000 videos.
You find that 2% of these videos are cat videos.
-
Determine which of the following is an observation, a variable, a sample statistic (value calculated based on the observed sample), or a population parameter.
- Percentage of all videos on YouTube that are cat videos.
- 2%.
- A video in your sample.
- Whether a video is a cat video.
Principles of experimental design
Control - for any differences between groups (treatment and control)
Randomization - sample into groups to control for confounding factors
-
Replication
- Single study - replicate by collecting a large enough sample
- Another study - should be able to replicate results
Observational studies
Prospective: data in the future identify sample and follow
Retrospective: data from the past
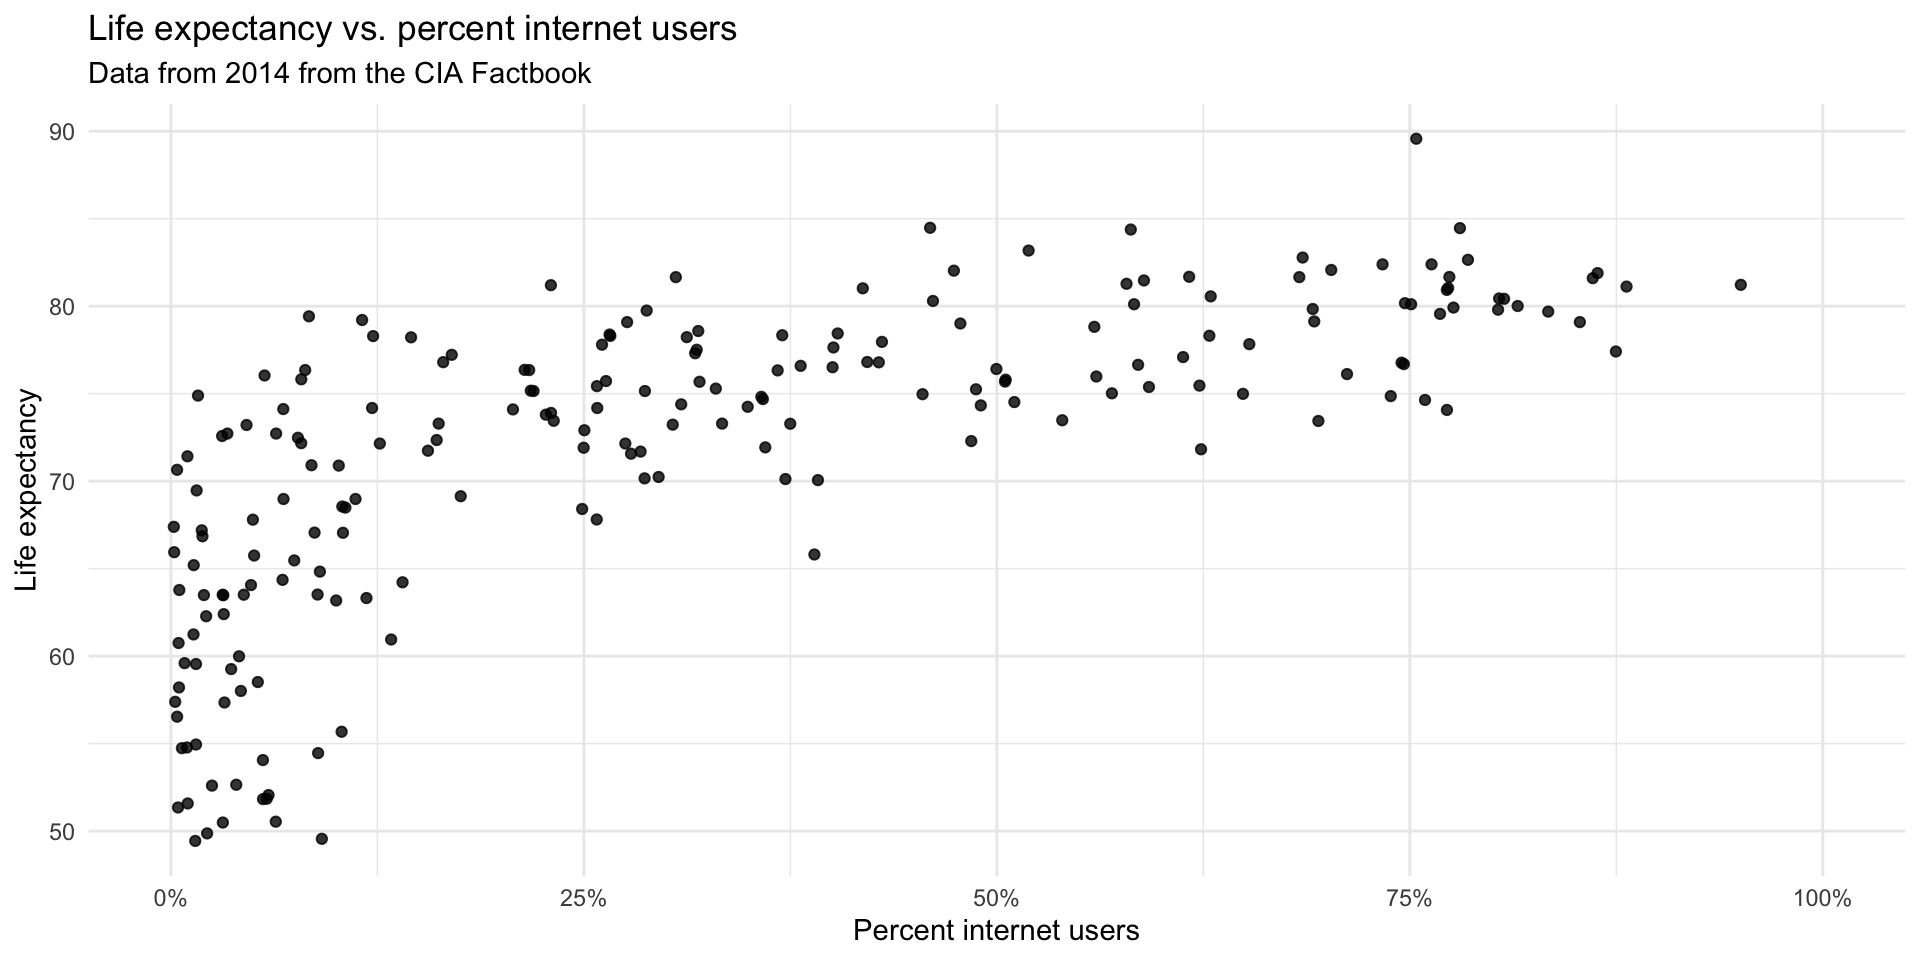
Your turn E11
Describe the relationship between life expectancy and percentage of internet users.
What type of study is this?
State a possible confounding variable that might explain this relationship and describe its potential effect.
Anecdotal evidence
- A personal story or example that is not based on research or evidence
Bias in sampling
- Non-response bias
- People who don’t respond are different from those who do
- People who don’t respond are different from those who do
- Convenience sampling
- People who are easy to reach are different from those who are not
Summary
- Identify target population for your question
- Identify individual case from target population
- Describe difference between a census and a sample
- Describe difference between sample statistic and a Population parameter
- Describe anecdotal evidence
- Detail why random sampling is important
- describe how bias can be introduced into a sample
Quiz
One question on a dataset from an OpenIntro Data Set
Two questions on definitions in Chapter 2 Study design